The Content Distribution Checklist: How to Amplify Every Piece You Publish
Here’s what we see at Iriscale: teams ship strong content, then watch it disappear. The problem isn’t quality—it’s distribution. Organic reach has collapsed (Facebook sits around 1.1%–2.2% in 2024 [1]; LinkedIn organic reach is down 65% from peak [2]). This guide gives you a repeatable content distribution checklist to plan channels, timing, measurement, and governance—then operationalize it with Iriscale’s marketing intelligence platform.
Overview
Most teams still publish and pray: hit “post,” share once, move on. The result? One benchmark claims 80% of small business content gets fewer than 100 views without a distribution plan [3]. Meanwhile, buyers are overwhelmed—NetLine’s 2024 research found a 31.2-hour consumption gap between content request and actual engagement [4]. Translation: even when people want your content, you still have to architect how it will be found and trusted.
A modern content distribution strategy is not a posting calendar. It’s a governed system that connects content architecture to business goals, selects owned/earned/paid channels based on audience behavior, sequences timing with data, automates workflows, and measures engagement to pipeline outcomes.
What you’ll learn:
- How to map each asset to goals, audiences, and conversion paths
- How to choose the right owned/earned/paid mix with concrete channel examples
- How to sequence distribution over days and weeks to compound reach
- How Iriscale’s marketing intelligence platform automates, governs, and reports distribution at scale
- The exact content distribution checklist you can reuse for every launch
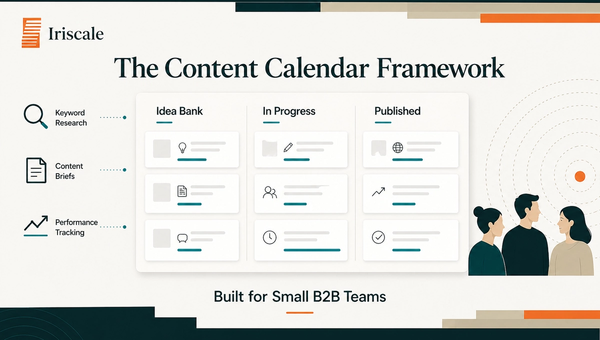
1. Map Content to Architecture & Goals
Before you pick channels, define what the asset does in your system. At Iriscale, we treat each piece as a node in an architecture: a pillar page, a cluster article, a product narrative, a webinar, a case study, or a conversion asset. Content without a defined role creates two failures: distribution chaos (“share it everywhere!”) and measurement confusion (“we got views… now what?”).
Start with a one-page distribution brief attached to every asset:
- Primary goal: awareness, subscriber growth, MQL/SAL, retention, expansion
- ICP and buying committee: who needs to see it and who influences
- Stage: problem-aware, solution-aware, vendor-shortlisting, customer enablement
- Core message & proof: one claim + one evidence point (stat, case proof, demo)
- Conversion path: next best action (newsletter signup, webinar, demo, trial)
NetLine’s consumption-gap finding (31.2 hours) reminds us that “intent” doesn’t equal “attention” [4]. Your architecture should assume multiple touches are required.
Concrete examples:
- SEO cluster article → email capture: Publish an article optimized for a high-intent query, embed a template CTA, route new subscribers into a short onboarding series (owned + SEO).
- Webinar → multi-format campaign: One webinar becomes 8–12 distribution units: a LinkedIn teaser clip, an email invite, a recap post, 3 short “lesson” posts, 1 gated replay landing page, and a retargeting segment (owned + paid).
- Case study → sales enablement + paid: Turn a case study into a 60-second vertical video for paid social and a 1-page PDF for SDR sequences.
Next steps:
- Define one primary KPI and one secondary KPI per asset (e.g., “demo-starts” + “newsletter opt-ins”).
- Document “where this asset lives” in your pillar/cluster map so every distribution touch links to a coherent destination.
Content Marketing Institute research emphasizes aligning strategy to organizational goals and audience needs [5]. Make that alignment explicit in your distribution brief so it can be governed and repeated.
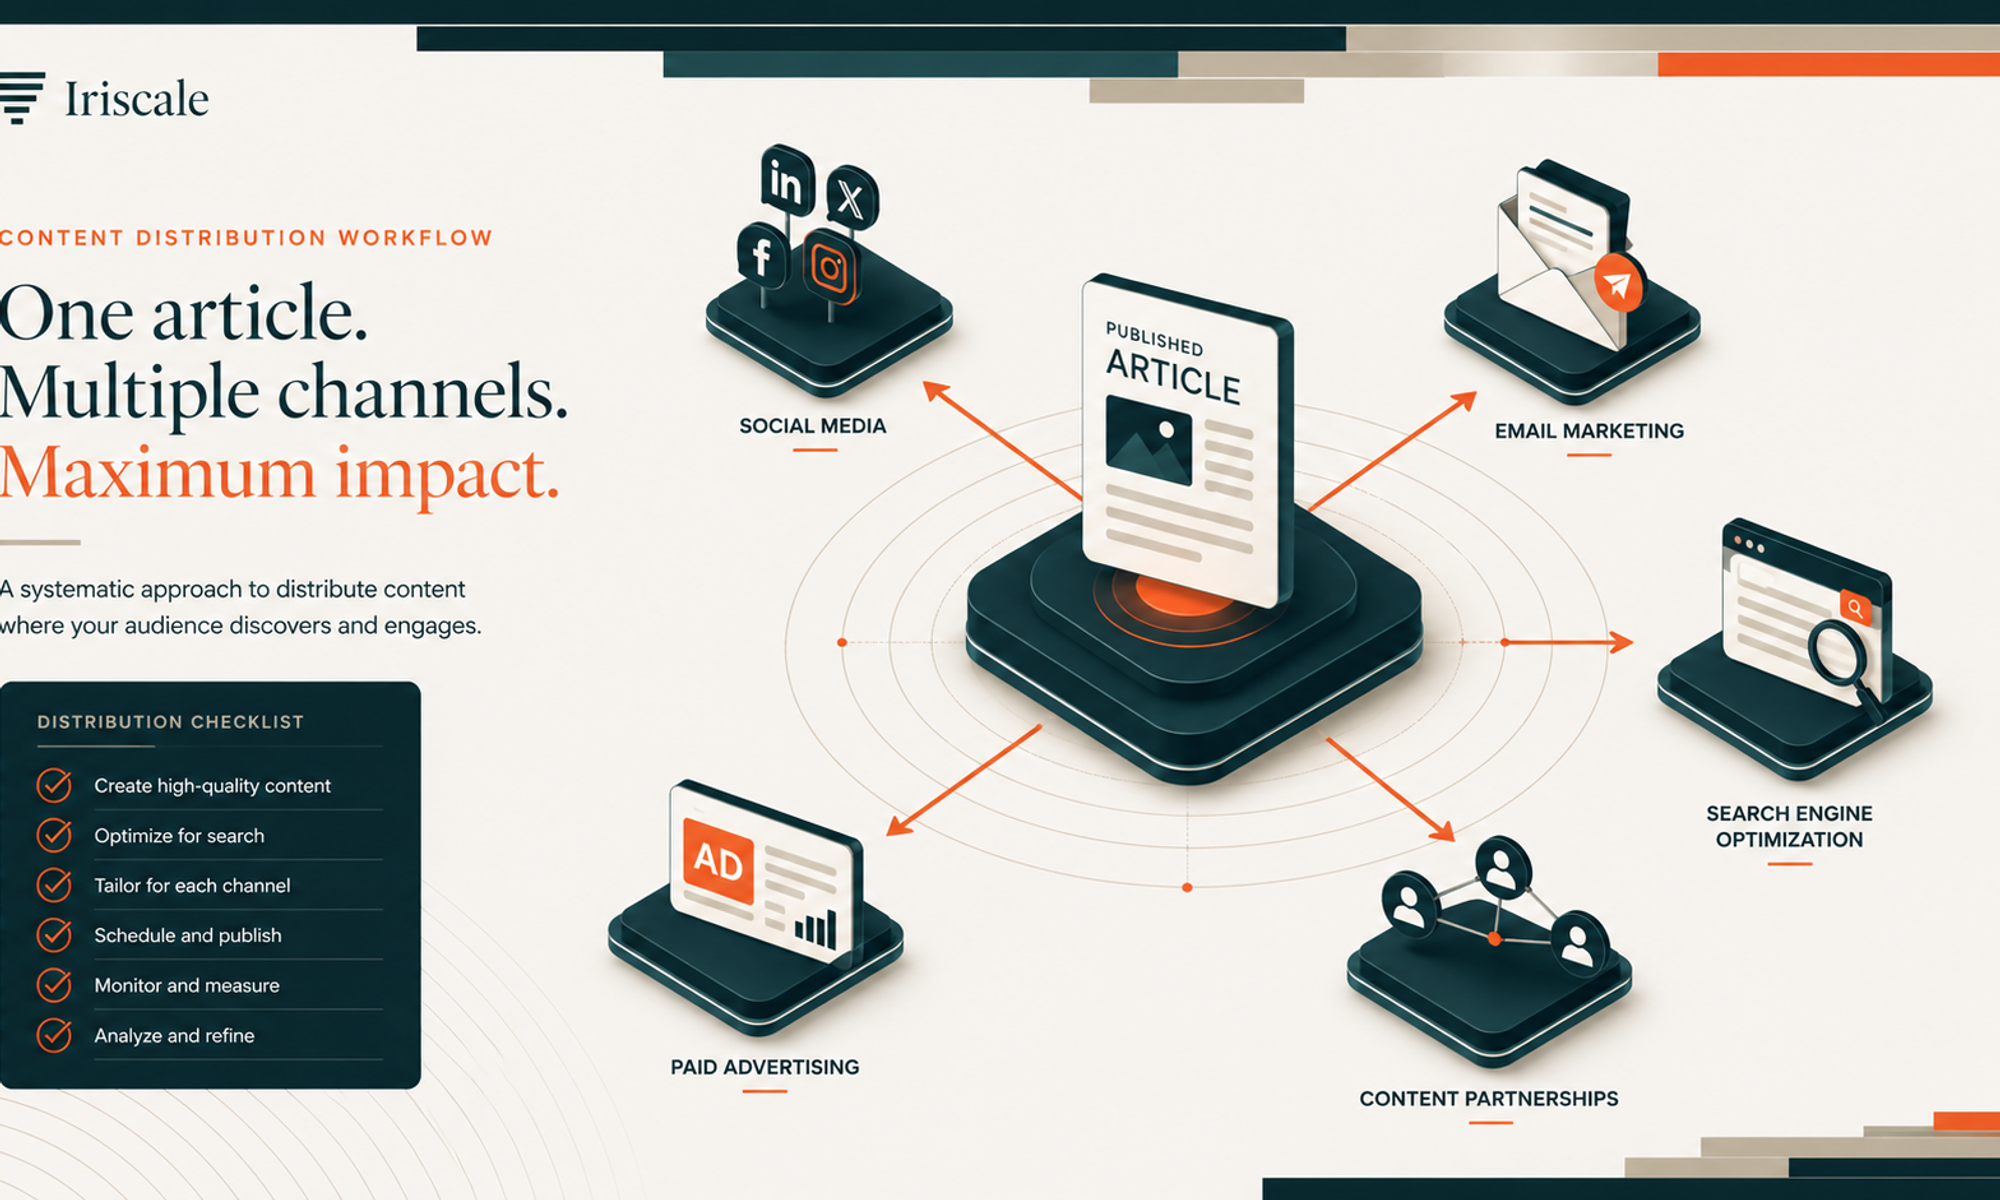
2. Choose Owned/Earned/Paid Channels Strategically
A checklist isn’t “post on LinkedIn, send an email.” It’s choosing the right mix for your asset role, audience, and objective—then aligning effort to expected reach. Organic social reach is harder than it used to be (Facebook 1.1%–2.2% organic reach [1]; LinkedIn reach down significantly from peak [2]). That doesn’t mean stop organic. It means stop treating organic as the only lever.
Use this selection matrix:
| Channel type | Best for | Examples | When to use |
|---|---|---|---|
| Owned | predictable reach + compounding | email newsletter, lifecycle emails, blog/SEO, in-product, community | always-on foundation |
| Earned | credibility + trust | influencer mentions, podcasts, partner newsletters, PR, community shares | when proof and trust matter |
| Paid | controllable scale + targeting | paid social, retargeting, newsletter sponsorships, syndication | when speed and precision matter |
Benchmarks to ground decisions:
- Email remains a top owned channel: median B2B open rates around 36.7%–42.35% and CTR 2.0%–4.0%, with ROI estimates of $36–$42 per $1 spent [6].
- LinkedIn paid benchmarks: sponsored content CTR around 0.44%–0.65%, with CPC around $5.58 [7].
- Content syndication: one benchmark claims 6–8% lead conversion within 90 days and roughly half the CPL vs. some intent-only programs [8]. (Treat as directional; validate in your own funnel.)
Concrete channel examples:
- Email + LinkedIn + retargeting: Send a newsletter feature (owned), post 3 LinkedIn angles over 10 days (owned/social), retarget page visitors with a short proof-based ad (paid).
- Syndication + nurture: Syndicate a gated version of a high-value asset for net-new leads (paid/partner), move them into a segmented nurture stream with the “next 3 best assets” (owned).
- Influencer earned + repurposed clips: Offer an influencer a co-created angle, repurpose the conversation into clips and quote cards to distribute across your channels. Sprout Social’s benchmarks emphasize authentic community-based influencer engagement over broadcast-only tactics [9].
Next steps:
- Choose one “anchor channel” (where your audience reliably pays attention) and two “support channels.”
- Avoid channel duplication: don’t post the same message everywhere. Create 3–5 “message angles” (problem, proof, objection, contrarian insight, how-to).
3. Optimize Timing & Cadence With Data
Timing is not “best time to post” blog advice—it’s sequencing touches so the asset compounds. Because attention is fragmented, one-and-done distribution wastes the asset’s potential. NetLine’s consumption-gap research (31.2 hours) implies your audience may intend to engage but delay it [4]. Your job is to design re-encounters without spamming.
A practical cadence model (B2B, per asset launch):
- Day 0 (publish): blog live + initial email or community post
- Day 1–3: LinkedIn post #1 (hook + promise) + sales enablement snippet
- Day 4–7: LinkedIn post #2 (proof + counterpoint) + newsletter “roundup” inclusion
- Day 8–14: short video clip or carousel + retargeting starts (if applicable)
- Week 3–4: republish angle as partner co-marketing or syndication; update internal enablement
Channel-specific timing tips:
- Email: optimize for mobile—62% of emails are opened on mobile, and AI-driven personalization was associated with a 41% increase in revenue per email [10]. Use short subject lines, one clear CTA, and a “read later” fallback (save link).
- LinkedIn organic: engagement averages have modestly increased in some datasets (Statista cited average post engagement rising from 1.57 to 1.74 from 2024 to 2025 across 64,409 accounts) [11], but reach concentration remains real (top creators disproportionately benefit, and reach has been reported down from peak) [2]. Plan multiple angles rather than hoping one post hits.
- Paid: don’t launch paid amplification until you have early signal (e.g., above-median on-page engagement or strong email CTR). Then scale the winners.
Two quick case snippets:
- Failure mode (publish and pray): A multi-brand team shipped 20 articles/month but only shared each once on LinkedIn. After 60 days, most posts produced minimal traffic, and sales couldn’t reuse the content because the message differed by brand. The fix was a single distribution brief + governed message library, then a 14-day cadence per priority asset.
- Success mode (sequenced amplification): A B2B SaaS team turned one webinar into a 3-week sequence: email invite → LinkedIn clips → partner newsletter → retargeting to replay. They saw replay attendance and demo requests increase because buyers encountered the same promise across multiple contexts.
Next steps:
- Build a “minimum effective cadence”: at least 6–10 touches per priority asset across 2–4 weeks.
- Use data to cap frequency: if CTR drops or negative feedback rises, rotate angle/format instead of pushing harder.
4. Automate Distribution Workflows via Marketing Intelligence
Even strong strategies fail when execution is manual. Scaling distribution across multiple brands typically breaks in four places: handoffs, approvals, inconsistent UTM/tagging, and fragmented reporting. CMI research shows 89% of marketers use AI for activities like brainstorming and summarization [12]—but automation without governance can create brand risk, duplicated posts, and measurement noise.
This is where Iriscale’s marketing intelligence platform becomes operationally decisive: it doesn’t just “schedule posts.” Iriscale helps you automate and govern the entire content marketing workflow end-to-end, with human-in-the-loop controls.
What to automate (without losing control):
- Distribution briefs → channel plans: Convert your architecture/goals into templated channel sequences (e.g., “SEO cluster launch,” “webinar campaign,” “case study push”).
- Asset packaging: Auto-generate channel variants (headlines, snippets, UTM links, creative requests) while keeping approvals human-led.
- Workflow orchestration: route tasks to owners (content, social, lifecycle, paid, PR, brand) with SLAs and dependency logic (“paid starts after creative approval”).
- Unified measurement: collect performance across channels into one campaign record so you can compare like-for-like and avoid spreadsheet attribution arguments.
Iriscale differentiators:
- End-to-end platform: planning → activation → measurement in one system (less tool sprawl, fewer handoffs).
- Human-in-the-loop automation: AI accelerates variations and routing, while your team approves messaging, claims, and brand tone. This matters because trust is fragile; Edelman’s Trust Barometer highlights how innovation can introduce new trust risks [13].
- Brand governance at scale: enforce naming conventions, required disclaimers, UTM standards, and message hierarchies across brands and regions.
- Unified data model: consistent taxonomy (campaign, asset, audience, stage) so reporting is comparable.
Workflow illustration (what it looks like in practice):
- Content manager publishes the asset and selects “Distribution Template: Product Education (14-day).”
- Iriscale creates tasks: email module, 3 LinkedIn variants, syndication brief, paid retargeting audience build, and sales snippet.
- Brand/legal get routed only the items that require review (not every post).
- Once approved, Iriscale activates/syncs and standardizes tracking.
- Performance rolls up to a single view: reach, engagement, assisted conversions, and pipeline signals.
Next steps:
- Standardize 3–5 templates (not 30). Templates drive adoption.
- Make governance invisible: embed rules into the workflow so teams don’t “forget” tracking or brand requirements.
5. Measure, Learn, and Iterate (Feedback Loops)
Distribution is a system; measurement is the control plane. If you only report top-of-funnel vanity metrics, you’ll optimize for the wrong thing—and your team will lose confidence in the process. Demand Gen Report research shows many teams prioritize acquisition metrics like MQLs/SALs (48% citing them as key success metrics) [14]. That’s useful, but only if you also track leading indicators that explain why pipeline moved.
Set up a KPI stack by funnel layer:
Channel health (leading indicators)
- Email: opens, CTR (benchmarks often cited 2–4% CTR for B2B) [6]
- Social (organic): engagement rate, saves, comments-to-impressions ratio
- Paid: CTR (LinkedIn 0.44%–0.65% directional) [7], CPC, frequency, landing-page CVR
- Syndication: lead conversion rate within 90 days (directional 6–8%) [8]
Content quality signals
- Scroll depth / time on page (where available)
- Return visits
- Assisted conversions (content touched before demo/trial)
Business outcomes
- Subscriber growth and activation (e.g., first-week email engagement)
- Demo/trial starts, sales meetings booked
- Pipeline influenced / revenue (with attribution caveats)
How to run the feedback loop:
- Baseline: define “expected ranges” per channel using your last 90 days plus external benchmarks as sanity checks [6][7].
- Review weekly for priority assets: Which angles drove CTR? Which channel introduced the most qualified sessions?
- Diagnose: Was underperformance a message issue, audience mismatch, creative, or landing-page friction?
- Iterate quickly: swap headline/creative, change the CTA, adjust targeting, or repurpose into a better format.
Two common objections (and fixes):
- “Attribution is messy, so measurement is pointless.” Fix: focus on directional lift and consistent taxonomy; compare campaigns to your own baselines.
- “We don’t have time to analyze.” Fix: automate dashboards and alerts. Iriscale’s marketing intelligence platform consolidates performance so insights don’t require manual exports every week.
Next steps:
- Track one metric per channel that your team can influence weekly (e.g., email CTR, paid CTR, landing CVR).
- Build a “winner library”: store the top 10 hooks, CTAs, and formats by audience segment so you reuse what works.
6. Maintain Brand Consistency at Scale
As you scale across multiple brands, regions, and teams, inconsistency becomes a distribution tax. The same asset gets described five different ways, UTM parameters fragment reporting, and claims drift—creating legal risk and eroding trust. Edelman’s trust research underscores that trust is sensitive to perceived credibility; inconsistency can undermine believability even when the content is accurate [13]. Meanwhile, AI makes it easier to produce variations quickly, increasing the need for governance (CMI reports broad AI usage in content workflows) [12].
A scalable governance model has three layers:
1) Message architecture (what can’t change)
- Core promise (one sentence)
- Proof points (approved stats, customer outcomes, demos)
- Positioning boundaries (what you do/don’t claim)
2) Brand expression (what should be consistent)
- Tone, terminology, capitalization rules
- Visual system (templates, safe zones, logo rules)
- Required disclaimers (industry/region-specific)
3) Local flexibility (what can change)
- Hooks and examples tailored to segment
- Channel-native formatting (threads, carousels, short clips)
- CTA variants by stage (subscribe vs. demo)
Concrete examples of governance in distribution:
- LinkedIn post variants: allow multiple hooks, but enforce the same approved claim and CTA.
- Syndication briefs: enforce approved titles, bullet summaries, and lead routing rules so you don’t pay for low-quality handoffs.
- Sales enablement snippets: lock the “approved proof” block (numbers, outcomes), while allowing reps to personalize the opener.
How Iriscale supports governance:
- Centralized message libraries and templates for each brand
- Approval routing that matches risk (e.g., regulated claims go to legal; simple social posts go to brand only)
- Enforced campaign taxonomy so cross-brand reporting remains consistent
- Human-in-the-loop review so AI-generated variants don’t introduce off-brand phrasing
Next steps:
- Create a “distribution-ready” content package: 5 hooks, 3 CTAs, 10 approved proof bullets, and 6 visual templates per brand.
- Audit governance quarterly: sample 20 distributed posts and check consistency, tracking, and claim accuracy.
Checklist
Use this content distribution checklist for every asset:
- [ ] Asset role defined (pillar/cluster/enablement/conversion)
- [ ] Goal + primary KPI + secondary KPI set
- [ ] Audience + stage + next-best action documented
- [ ] 3–5 message angles written (problem, proof, objection, how-to, contrarian)
- [ ] Owned plan: email module + site placement + internal enablement
- [ ] Earned plan: partners/influencers/communities list + outreach snippet
- [ ] Paid plan: retargeting + audience + creative + budget guardrails (if needed)
- [ ] Cadence scheduled (minimum 2–4 weeks, 6–10 touches for priority assets)
- [ ] Tracking standardized (UTMs, naming conventions, campaign taxonomy)
- [ ] Governance applied (brand/legal approvals where required)
- [ ] Reporting view created (channel health + content quality + business outcomes)
- [ ] Post-launch review date set (7/14/30 days) with iteration actions
Related Questions
What’s the difference between a content distribution strategy and a content distribution checklist?
Your strategy defines principles (audience, positioning, channel mix). The checklist turns that strategy into repeatable execution steps so every launch includes channel planning, tracking, and review.
How many channels should you use per piece?
For priority assets, aim for 2–4 channels with one anchor (often email or SEO) plus supports (LinkedIn, partners, paid retargeting). Multi-channel distribution broadens reach and can accelerate decisions, as HubSpot notes in its multi-channel guidance [15].
Is organic social still worth it if reach is declining?
Yes—if you treat it as a sequenced system (multiple angles, formats, and employee/partner lift). But declining reach benchmarks (Facebook ~1.1%–2.2% [1]; LinkedIn reach down from peak [2]) mean organic should be complemented by owned and selective paid.
When should you pay to amplify content?
Use paid when speed, targeting, or retargeting is required—especially for conversion assets. Start with small tests; scale only after you see strong early engagement and landing-page conversion.
How do you keep brand consistency across multiple brands and AI-generated variants?
Use message libraries, templates, and risk-based approvals. Iriscale’s marketing intelligence platform with human-in-the-loop governance helps you move fast without letting claims and tone drift.
CTA
Want to operationalize this content distribution checklist across teams, brands, and regions—without turning your process into spreadsheets and status meetings? Iriscale helps you plan distribution architecture, automate multi-channel workflows, enforce brand governance, and unify performance data in one marketing intelligence platform—with human-in-the-loop controls where it matters most. Book an Iriscale demo or start a free trial to turn every launch into a measurable, repeatable amplification system.
Sources
[1] https://www.rebootonline.com/media/downloads/content-marketing-statistics-summary.pdf
[2] https://contentmarketinginstitute.com/content-marketing-strategy/content-marketing-statistics
[3] https://www.contentbycass.com/blog/40-b2b-content-marketing-statistics-you-cant-ignore
[4] https://contentmarketinginstitute.com/b2b-research/b2b-content-marketing-trends-research-2025
[5] https://www.semrush.com/blog/content-marketing-statistics/
[6] https://nytlicensing.com/latest/trends/b2b-content-marketing-2021/
[7] https://www.mckinsey.com/capabilities/growth-marketing-and-sales/our-insights/five-fundamental-truths-how-b2b-winners-keep-growing
[8] https://www.marketingprofs.com/charts/2024/50567/b2b-content-marketing-benchmarks-budgets-trends-outlook-2024-research
[9] https://53a3b3d3789413ab876e-c1e3bb10b0333d7ff7aa972d61f8c669.ssl.cf1.rackcdn.com/DGR_DG283_SURV_ContentPref_April_2024_Final.pdf
[10] https://www.linkedin.com/posts/techgeer_120-key-b2b-marketing-statistics-and-facts-activity-7269755971340554241-RnMO
[11] https://campaignpros.io/learning-center/facebook-organic-reach-decline
[12] https://www.facebook.com/UrbanFarm.Solutions/videos/facebooks-organic-reach-has-dropped-significantly-social-status-who-collate-mont/25982902594632226/
[13] https://www.facebook.com/smexaminer/posts/hows-your-organic-reach-on-facebook-in-2024-vs-2023-improving-about-the-same-or-/981076217396011/
[14] https://www.reddit.com/r/facebook/comments/198xpwj/why_is_facebook_reach_in_the_toilet_in_2024_why/
[15] https://medium.com/@jarrod-reque/why-organic-social-media-growth-is-so-difficult-today-c16da4969317